Start September right with our latest Observatory updates.
We hope you have had a great summer and are entering September feeling refreshed and ready for the academic year ahead. We have been busy adding more features and flexibility to your Observatory account. We hope these new additions will continue to help make your work-life easier.
Better organised KPIs
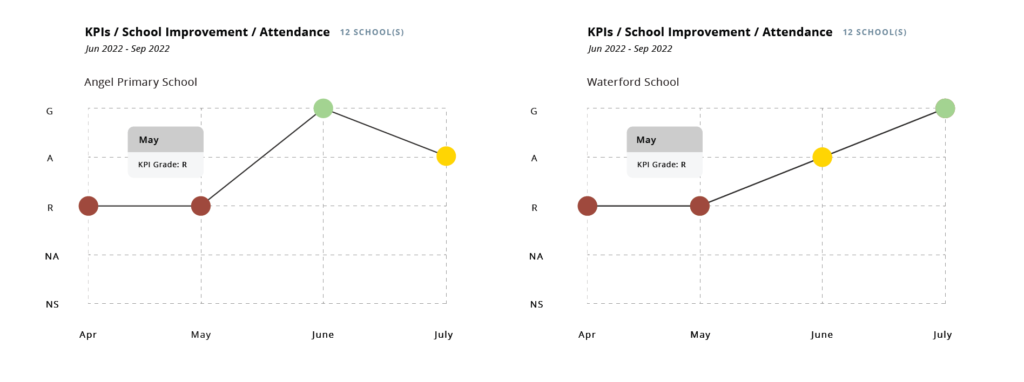
During this update, we have introduced a few enhancements to improve our KPIs and how they work for you… Within the Intelligence section, we have now added in the ability to trend your KPIs. Choose a KPI template to see all KPIs for a single school over time. Alternatively, you can choose a specific KPI and see the trend over time across all your schools (example shown below).
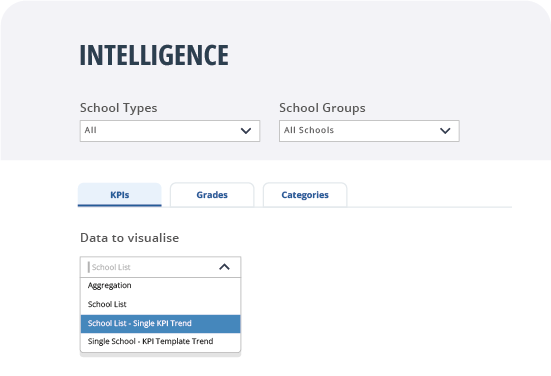
Pssst… You will find the KPI Trend options in the new handy “Data to visualise” drop-down which replaces the “switch view” button (see screenshot).
That’s not all! We’ve also introduced a new “change order” button into your settings. Your KPI templates can now be ordered to match your organisation’s priorities and will be reflected on your schools’ dashboard.
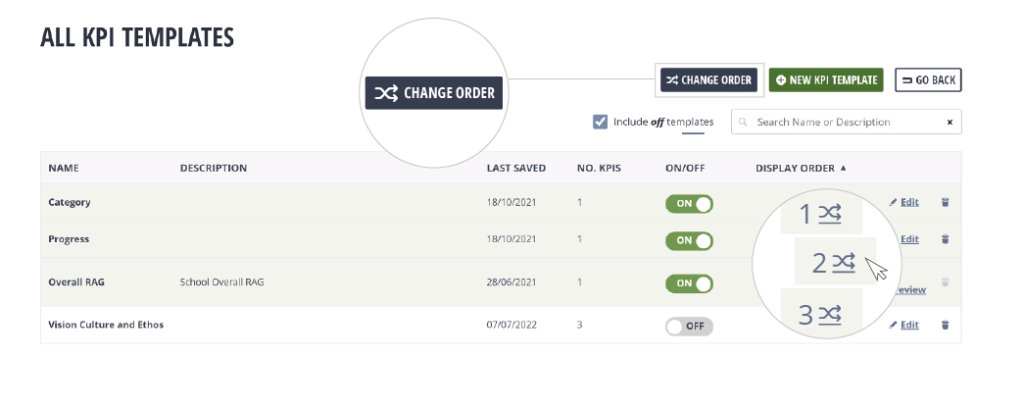
You have always been able to turn KPI templates on/off. You can now choose to filter on those templates in our KPI admin screen making it even easier to manage your KPI templates.
If you do need to delete a KPI, we’ve updated our pop-up to provide contextual information to help inform you about the choices you have when deleting a KPI.
Bring visit data to life…
We’ve delivered a new, snazzy, workload-reducing, time-saving, frustration-free, data-driven visits dashboard!
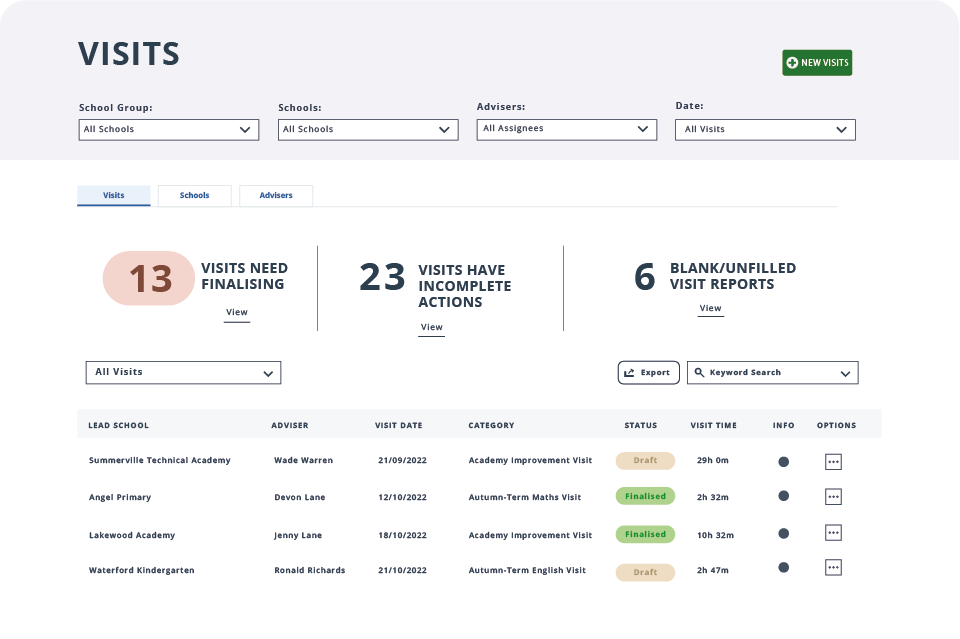
On top of our existing Actions dashboard, our Premium users can now manage all their visits in one place (click on ‘activities’ in the menu).
Filter by visit type, date, status and adviser, and use the sort to find the information you need.

Our visits dashboard can really revolutionise the way you work! Enabling you to focus your limited time in the right areas based on the correct intelligence.
Pssst… Our handy prompts at the top of the page will draw your attention to valuable insights such as which visits need finalising or schools that haven’t had a visit.

Introducing MIS Attendance Data
Back in July, we launched our new MIS data analysis module for our Premium customers. We focused initially on school context and, as promised, we are now proud to bring you the second phase of MIS data analysis with a focus on attendance.

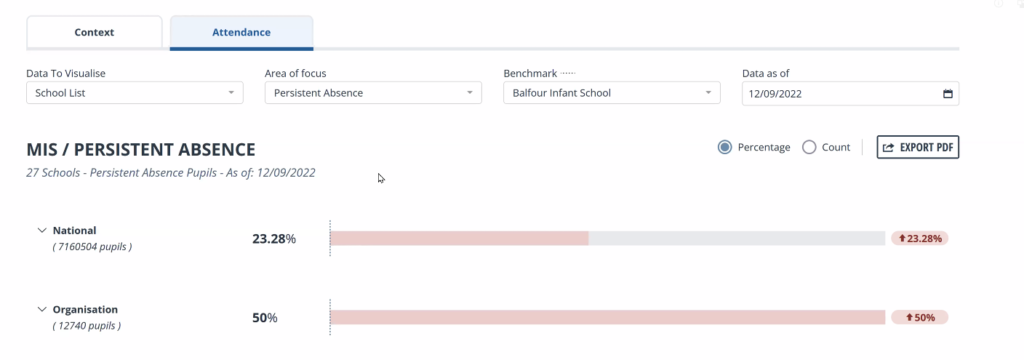
See the attendance data ranked for all your schools and benchmarked against your organisation and any available national data. Drill down into the attendance data for each school to see a breakdown by year group or highlight any trends.
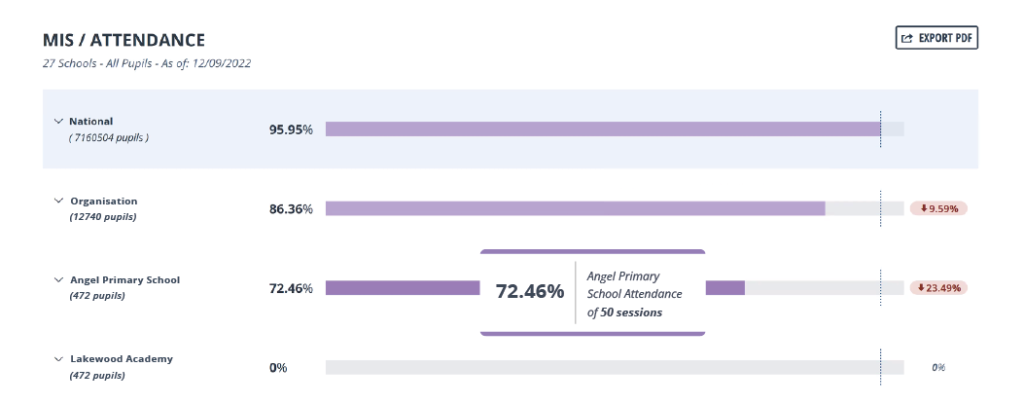
Choose to focus on attendance, authorised absence, unauthorised absence as well as persistent absence… You can even apply filters to the data such as FSM, pupil premium, EAL and many more!
Ready to get started?
Sign in now and see the updates for yourself.
Not currently a Perspective Observatory user?
Join us for a demo and we will show you how our users are benefitting.
If you or any colleagues would like training on any aspect of Observatory or have any other questions, please, don’t hesitate to contact us.
